Quick Start Guide
A quick demonstration of creating a streaming pipe in Ingext.
Walkthrough Demo those of you that just want to see things work, this guide is for you. The objective is to connect a data source to a data sink.
If you have not done so already, install an instance of Ingext Installation
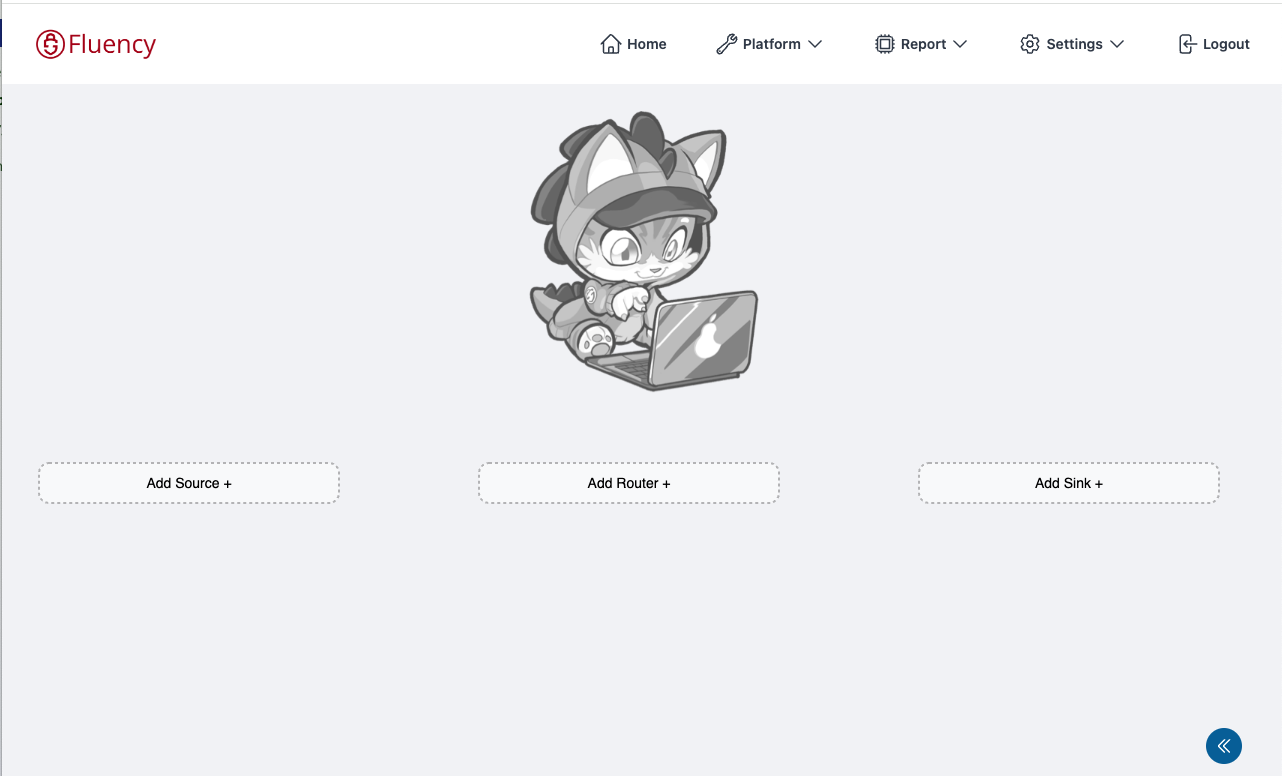
When you log into Ingext for the first time, you are greeted with an empty hone screen that has three buttons:
- Add Source
- Add Router
- Add Sink
Objective
In this example, you are going to create a HEC listener. You will then send a message to that listener, see it in the processing, and then send it to a drop sink.
What You Need
This is a basic Hello World program done IngeXt style.
- You will need to have a command prompt with the ability to send a
curlcommand. - You will also need to have a IngeXt account.
Creating the Data Source
You are going to create an HEC Data Source.
Click the "Add Source" Button
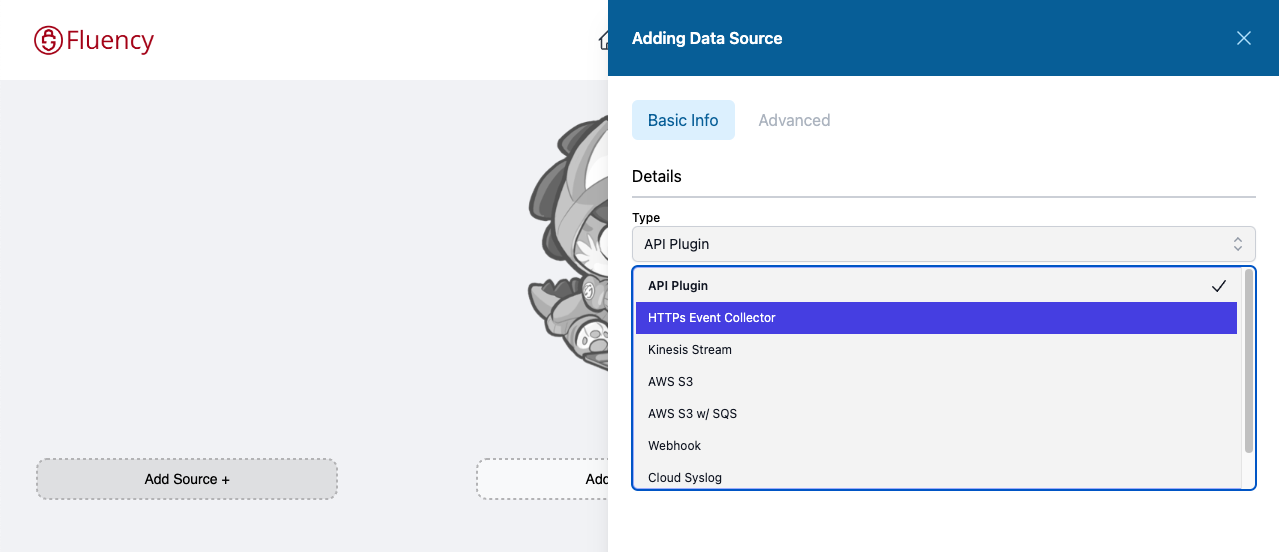
This is the button on the far left. We wan to first have a way to get data into the pipes. In this example, you are going to use the HTTP Event Collector (HEC) service. This is a popular service for modern audit collection.
Select HTTP Event Collector (HEC)
Clicking will bring up the pullout, and then select the HTTP Event Collector option.
Give it a name
Before you can save, you need to give the Data Source a name. The name is all one camel case work, meaning that you use capital letters to show the words inside the string.
In this case,
<About HEC>
Connecting a Processor
For now we are just going to connect a "Pass through" processor. A Pass through processor simply exports what it receives. This is where the magic happens in streaming. It is common that we would put a parser here. But for now we are just going to do a simple echo, where we write to the sink what we are getting from the source.
Click the Add Router
We first need to create the router and assign a processor.
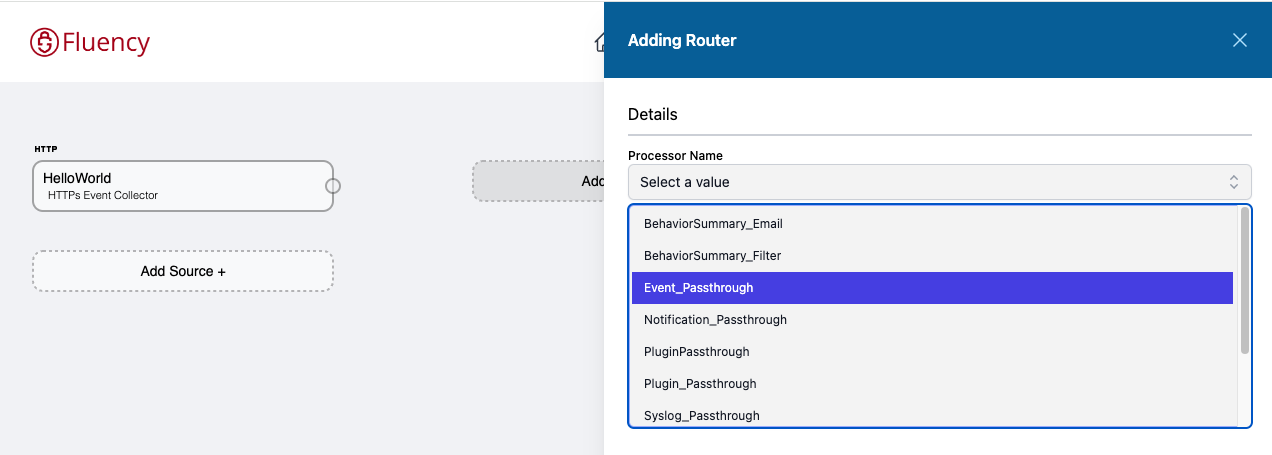
- Clicking the Add Router button, opens the "Adding a Router" pullout.
- We are going to select the Event_Passthrough for this example.
Create the Router
When you save this you should now see a router in the middle of the screen called Event_Passthrough.
View the Router
Processors are where the real power in Ingext is. Processors do parsing, metrics, transformation, and enrichment. Here we are just going to use the process to see what is going on.
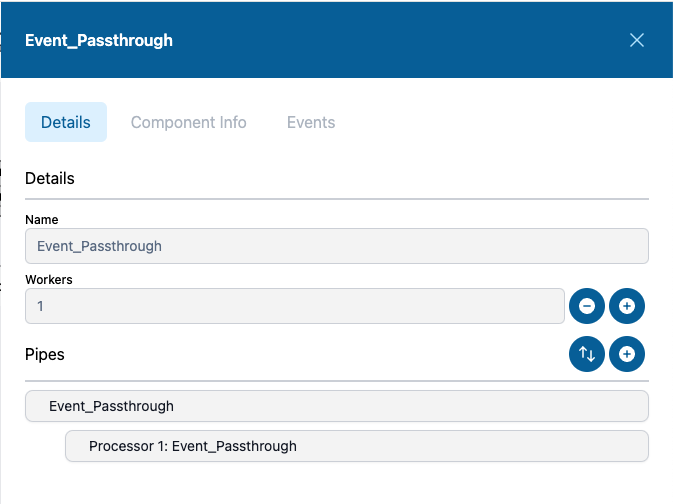
Processors belong to Pipes. Routers can have multiple Pipes.
A router has many pipes
This is a the process pullout. There are three actions on this page.
- Expand processor code: This will do a popup of the code to make it more readable.
- Edit: This allows an edit, latest events, and code debugging page. We will use this later when we test the Hello World install.
- Remove From Pipe: This will remove the process all together.
We will get back to this later.
Connect a Data Sink
You are going to create a drop sink. A drop sink takes a message and discards it. It is not that exciting. Drop sinks are used to track message that are being discarded.
To create a drop sink
A data sink is where the data does. This would normally be a s3 bucket, a web hook, or a tool, like a SIEM. In this case, we are creating a Drop bucket. This just helps us track better that we are going to throw away the data and not keep it. In later sections, we will change this.
For now
- click the Add Sink button.
- Give the sink a name.
- Save
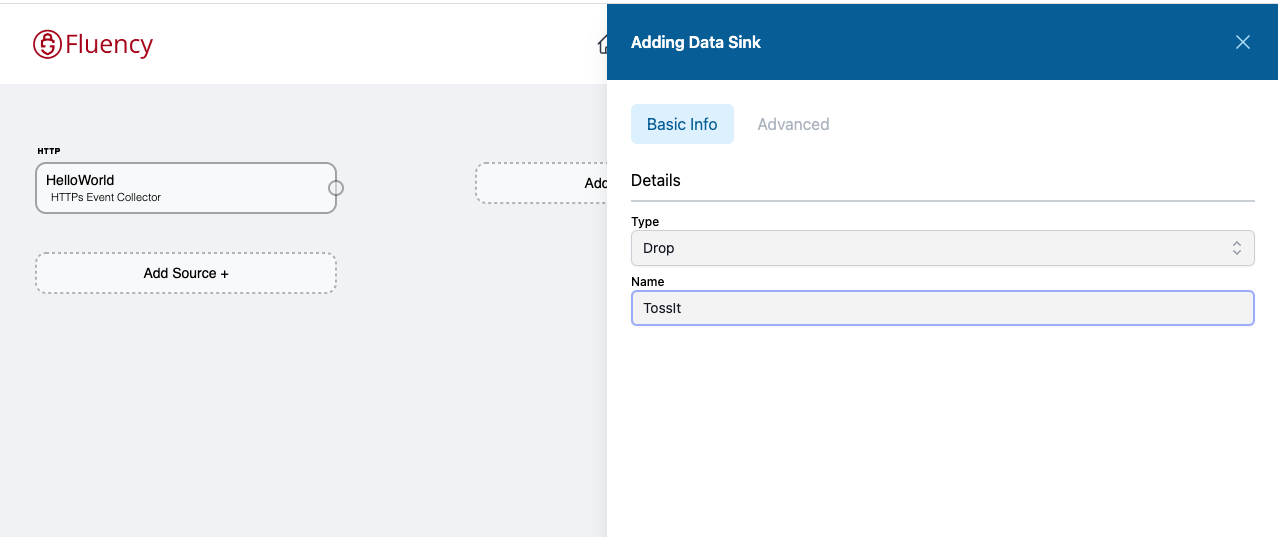
Add the Sink
This creates a sink to discard the incoming events.
Testing the Sink
We are going to send a message to the HEC.
Sending an HEC event.
This is where the curl command comes into play.
curl -H "Authorization: Ingext <TOKEN>" <HEC HTTP Address> -d '{"sourcetype": "curl prompt", "event": "Hello World"}'You are to replace the
<TOKEN>with the toke the interface asked you to copy and save.**<HEC ADDRESS>with the http address the interface provided.
Using a terminal, send this packet via curl. You should receive an OK response when this call is successful.
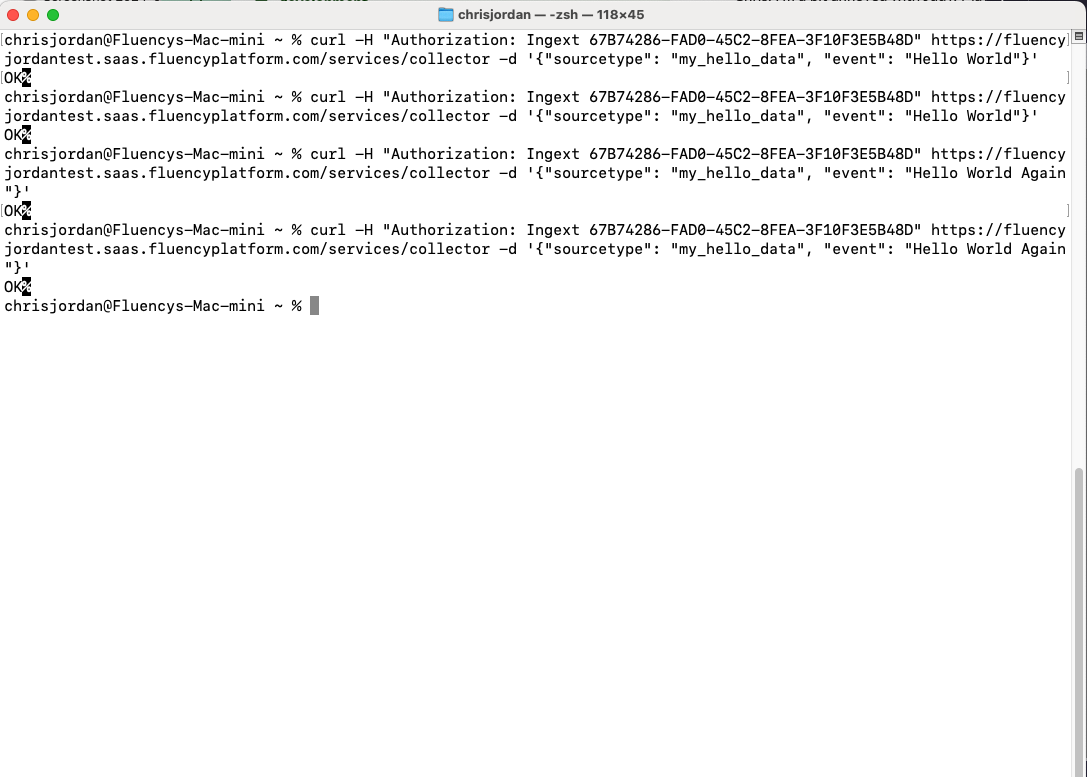
Terminal
There is a delay in HEC as it buffers the data and updates the pipe. You may want to refresh the page to accelerate the page polling.
Seeing the event in the Data Source
Back to the Ingext interface, wait until the data source card becomes green. You can then click on the data source.
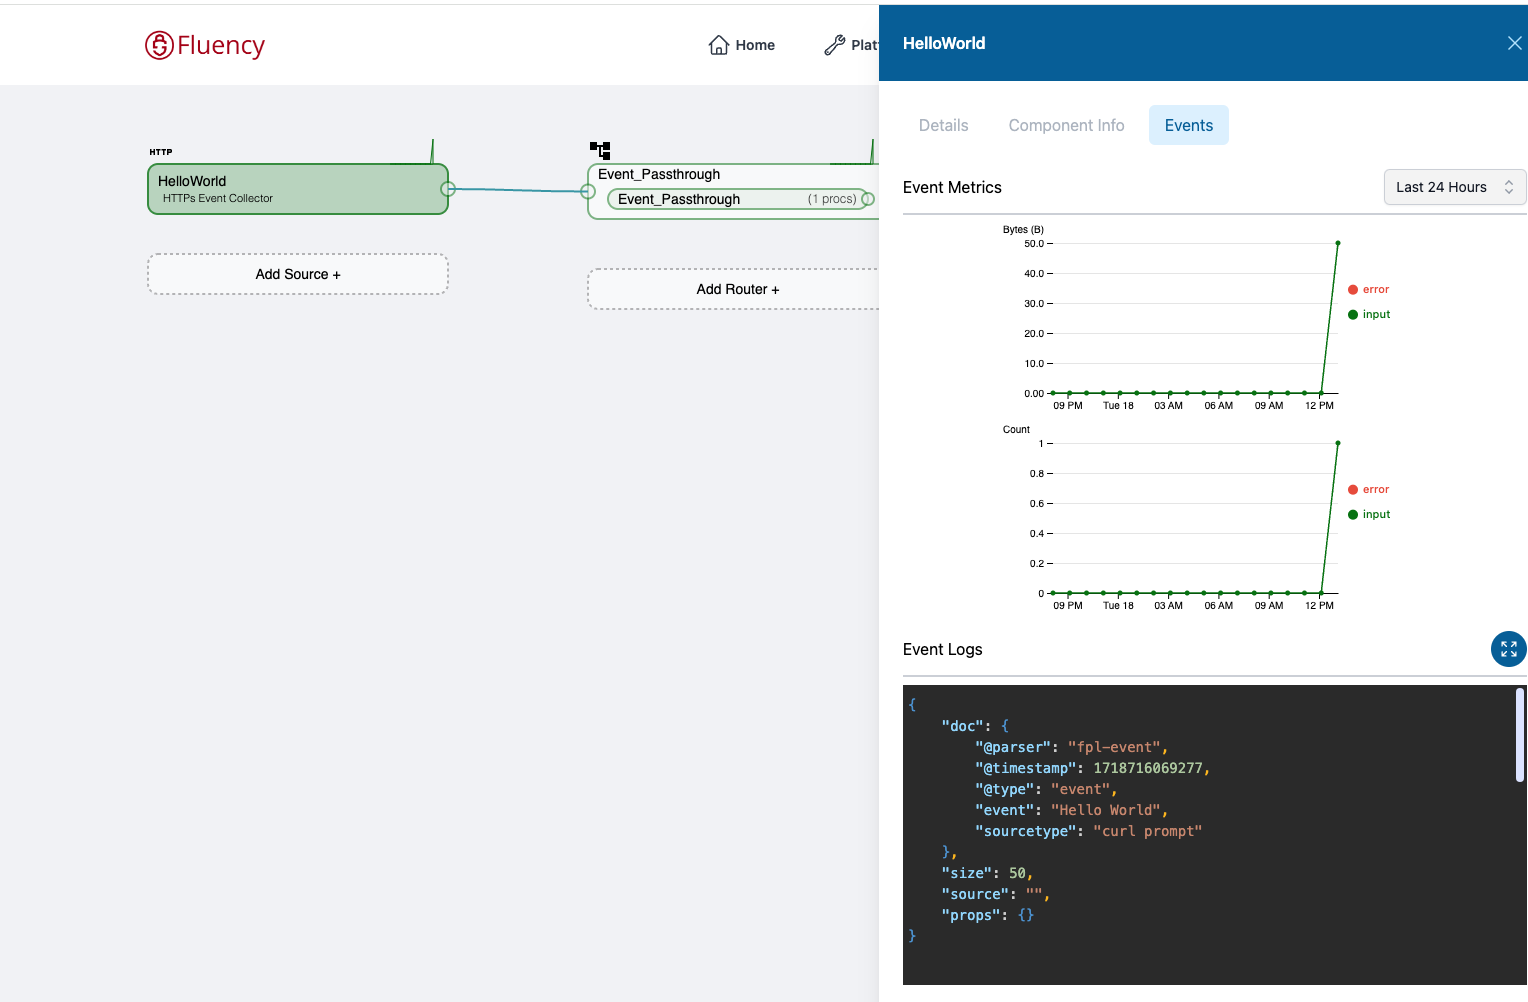
Data Source Pullout
When you open the pullout, select the Event tab. This will present a count (number of records) and bytes (total size) histogram. It also, under the event logs, shows the last incoming message.
Seeing the event in the Processor
We can see more of the messages and eventual parse and transform these by looking into the parser we created.
The trickiest part of this is clicking on the Processor. To do this. Click on the parser in the configuration page and get the pullout.

Processor Button
You want to click on the processor button, highlighted above in red. This will open the Processor panel. Then you can click the edit button to go to the Processor coding page by clicking the edit button (View Processor hint).
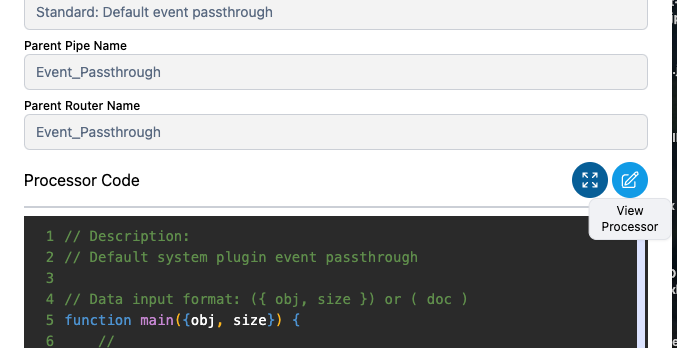
View Processor
This is the edit page for processor. It will allow you to transform and enrich the record before placing in the sink.
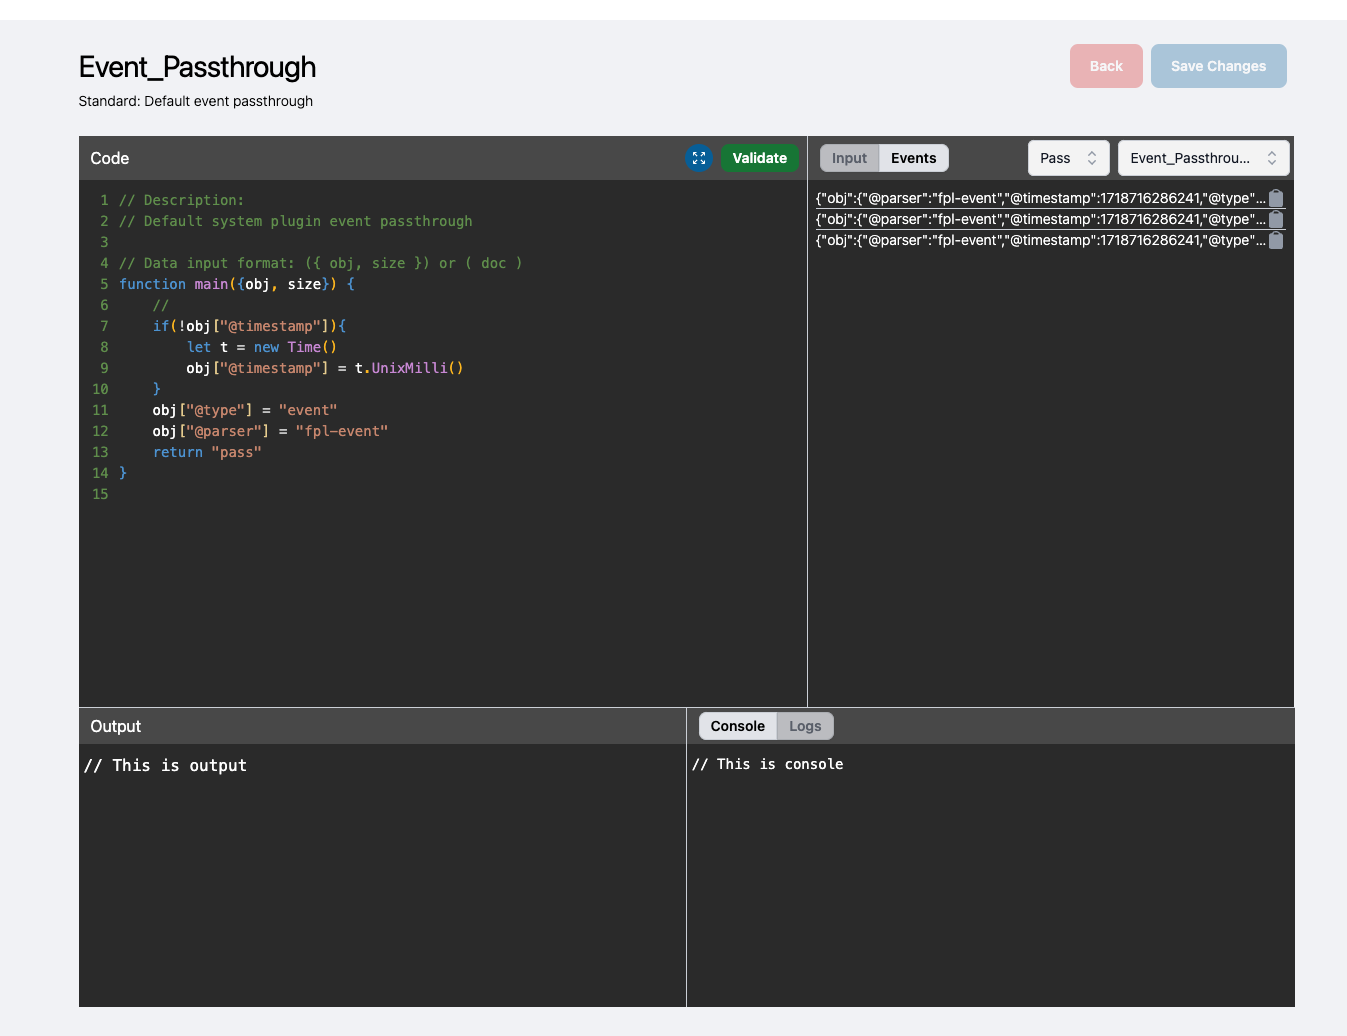
Edit Processor Page
This is a powerful page. For now, just click on the Events button, and you will see a list of messages that have been processed by the processor. Clicking on an events clipboard will place that event into the input buffer of the processor for testing and coding purposes.
Demo
You can visit the demo in its own tab.
Updated 4 months ago